Tuesday, August 31, 2010

Option Trade

Just a quick update today, based on a trade I made. Since my SPY put expired a week ago, I've been looking to buy back in. This is what I did.

Trade: buy 1% (of my portfolio) position in SPY Jan11 91 puts.

*Warning: this is a very risky, out of the money option that may not be appropriate for most investors.

The reason I bought this option is because of my opinion that the global slowdown in fiscal and monetary stimulus over the past 8 months will deflate equity prices.
With this option, I extended the maturity out almost 5 months. I picked the $91 strike price as an extremely speculative bet on a "fat tail." Now, I'm not an options expert by any stretch of the imagination, so this is more of an experiment than anything else. As such, I welcome any suggestions for better ways to capitalize on "fat tails" or other ways to exploit weaknesses in traditional pricing models.

I'm going to get a little technical here. The term "fat tail" refers to a non-normal distribution curve with a higher probability of extreme price movements. The difference between these distribution curves is pictured below.


The chart shows portfolio returns, but the same concept can be applied to options. Most stock and option pricing models used by traders assume a normal distribution. But history proves that price changes are more extreme than a normal distribution predicts. The Y-axis is the number of standard deviations from the mean. The X-axis is the probability of occurrance. The option I bought is at -1 standard deviation, which implies a normal distribution probability of about ~30%. But I think the market is more likely to fall than rise, so the option is most likely cheaper than it should be.

Friday, August 27, 2010

1,6% GDP growth is bad for Treasuries?

Really?
I can understand stocks rallying on Bernanke's pledge to prop up asset prices. Makes me think this today is just a bounce on oversold conditions. One-day Wonder perhaps?
 
Weren't we at 6% GDP growth in Q3 '09?

Tuesday, August 24, 2010

What does the high Yen mean for Treasury bonds?

The Yen is at a 15-year high. This is a sign of severe dislocation in the global markets. Other notable milestones include Treasuries at record low yields and housing sales at 1995 levels.


You wouldn't know pressures in the global economy were this extreme from looking at the trading ranges the S&P 500, MSCI emerging market index, gold, and oil have been trading in.

This mismatch makes me nervous. How much higher can the Yen go? If the Yen rally tires, will it bump those other indexes out of their trading ranges? The chart is not very helpful. Although the dollar is very low versus the yen, the right and left ends of the chart look eerily similar.

The Japanese economy is suffering from the high yen. Toyota recently pleaded with the central bank to engage in quantitative easing to push down the yen, as its cars manufactured in Japan have become uncompetitive as exports due to the high costs. In my opinion, the yen's strength has come from a flight to safety and global deflation fears. The high yen has now put pressure on the Japanese government to sell yen and buy dollars.

The speculators are front-running what they see as a sure thing in U.S. Treasuries. So far, though, the Bank of Japan has refused to comply. Even so, due to its strength against commodities, the DXY dollar index has bottomed and crossed above the 50-day moving average, according to economist Dave Rosenberg.


So, what can be expected if the Bank of Japan obliges its export sector? The most obvious thing would be a big bounce in the U.S. dollar. This would consequently crush commodities and U.S. equities. The recent charge in Treasuries would most likely be over, although that would depend on which maturities the Bank of Japan bought.

Now for the touchy-feely part (I am a strong believer in trading on gut instinct, provided it's trained correctly.) How do I feel about trading this?

My trigger finger is feeling itchy. I am tempted to try to front run a change in market behavior and sell Treasuries. However, I believe it is more prudent and disciplined to stick with my strategy of waiting for a change in market behavior and only then exiting. The change I am looking for would be Treasury yields rising on bad economic news (of falling on good news).

Until the Bank of Japan (or the Fed) prints, market participants will probably be paying attention to this possibility more than anything else.

Disclosure: long 30-yr Treasury bond, short SPY, long EDZ, long gold metal, long gold stocks and options

Sunday, August 22, 2010

Oil and deflation in Europe

How to play Oil?

Oil has been stuck in a $69 to $85 trading range for over a year. Today, it sits just below middle, at about $75. Yet the economic weather patterns are certainly pregnant with the chill of a deflationary freeze. On Thursday, the Philly Fed manufacturing index dropped again - to -7.7, the lowest since July '09, when the "green shoots" were still in infancy. And here's the Biggie: unemployment claims jumped again, to 500,000. This puts us back in recession territory - if you believe it ever ended. The frosting (pun intended) on the cake is Dave Rosenberg's (the best U.S. economist, in my opinion) data from Macroeconomic Advisors that shows GDP growth turning negative in both May and June. So 3rd quarter GDP has a strong chance of coming in negative. Is oil or any other major commodity priced for this?

There are also geopolitical concerns: many worry about Iran's nuclear ambitions and Israel's possible response. In my mind, this is too full of unknowns to make a judgement. I'll leave that analysis for Middle East experts. However, because it is a possible cause of a price spike, the best way to play oil would be with a put option. The option provides leverage, with a maximum loss of the option.

The future of Iraq is a longer-term, but perhaps an even more important geo-political factor. Oil field development contracts that the Iraqi government has signed with the world's major oil companies add up to a shocking total: over 10 million bpd of production by 2012. If Iraq remains a stable country, this level of oil production could make it the world's largest producer. According to the IEA, 2009 production was about 2.4 million bpd. A jump to 10 million bpd would add an enormous margin of production over current and projected demand. The IEA projects world oil demand of 88 million bpd in 2011. 7 million bpd represents an 8% margin of supply over demand. This may not sound like much, but the 1998 low of $12/barrel came at a time of 7% marginal excess supply. So, I think oil could easily fall 20-30%.

The next thing that concerns me before making an investment is how to play the idea. What security or securies should I use? Unfortunately, I'm not a big enough fish to play in the futures pool. Otherwise, futures or options on futures would probably be the way to go. So that leaves ETFs. These are kind of messy and complicated. USO is also in natural gas. Then there are the Ultra's: DIG (oil bullish) and DUG, (oil bearish). Does the leverage in DIG make it a good candidate for puts if I want to take a bearish position on oil? I dug up the following chart:


Interestingly, although DIG is supposed to have two times leverage on the Dow Jones Oil and Gas Index, the chart shows they track very closely over the past two years. However, the implied volatility of DIG puts is in the 50's, while USO puts are in the 30's. So why pay for the higher IV (implied volatility can be thought of as the cost of time decay inherent in the option price) on DIG? USO put options should be much cheaper and just as effective. I will keep these on my watch list and wait for an opportunity to pick them up.

Update on Europe

The German newspaper Spiegel reports that Greek austerity measures are working. So far, the budget deficit has been reduced by a spectacular 9.7%, and total spending has been reduced by 10%, almost twice the 5.5% required to receive burther bailout funds to refinance debt. This should be incredibly good news. So why are Greek 4-year bonds still yielding 11.9%?

Unfortunately, there are a couple side effects to austerity. First, 17% of Athenian stores have filed for bankruptcy. 25% of storefronts are for rent. The shipbuilding city of Perama suffers from unemployment of 70%. Government worker salaries have been cut 20%.

Greek GDP dropped by 1.5% in the last quarter. This explains how a total spending reduction of 10% resulted in a deficit reduction of only 9.7%. The hidden link in this equation is a drop in tax revenues. (If tax revenues had stayed the same, the spending and deficit reductions would necessarily equal each other.) But there's more. The austerity measures were supposed to raise numerous taxes. And revenue still fell. That's a bad omen.

Unfortunately, global liquidity is freezing up after 6 months of worldwide central bank tightening. My opinion is that the austerity measures are doomed to fail soon. The final confirmation of failure will come when tax receipts begin to fall faster than government spending cuts. With GDP forecast to fall by 4% this year, even the eternally overoptimistic species of professional economist agree that things are going to get a lot worse.

Greece has no source of economic growth, save cutting bureaucracy. In times of economic hardship, however, reforms are much harder to push through. Unfortunately, I believe that we will soon see riots as people get desperate.

The structure of the currency and banking system is also problematic for Greece. Everyone's earnings and savings are in Euros. Greek banks are easily linked to other European banks. So it's very easy for anyone with money or savings to quietly move most of it to safe places like Germany. I have a strong suspicion that Greek banks are under very tight capital constraints and very unlikely to lend to small businesses or anyone else.

Wednesday, August 18, 2010

Two Trades: Canada and Gold

Based on recent market developments, I am watching two trades. The first is a short position in EWC, the ETF tracking the MSCI Canada index. The second is long gold.


Why short Canada?

On the surface, Canada has a lot going for it. Their recovery seems firmly entrenched as commodity prices rebounded from the craters of early 2008. Last quarter, GDP grew at 6.1% annually. Joblessness has fallen in tandem with the recovery and is much lower than in the U.S. Canadian bank strength and capitalization is the envy of the world. Government finances are in much better shape than their southern neighbor.

On the contrary, all is not what it seems. Beneath the calm exterior, a storm is brewing. This storm is a product of two likely external factors. First of all, Canada is extremely dependent on the health of the American economy. The U.S. is Canada’s largest trade partner. Major exports are commodities, but manufacturing, including automobiles, is also export-dependent. This makes Canadian markets highly reliant on the American consumer. While not a consensus call, I believe that U.S. GDP will slow to negative growth by the fourth quarter. Along with this slowdown will come a sharp decrease in retail spending as high unemployment and deflationary credit conditions bite harder into the American wallet.

Second, China may be on the brink of a prolonged slowdown in GDP growth. For six months now, the Chinese government has been trying to delicately pop their real estate bubble. As a command economy, they might possibly be able to accomplish this without a market crash. However, construction and building is 50-60% of Chinese GDP, according to estimates I believe. This eats up a lot of commodities. Commodity producers represent a 43% weighting in EWC.
Finally, the Canadian housing market is rolling over. Major markets have shown the first sign of stress in recent months, as the Bank of Canada’s interest rate hikes take effect. Recently, the number of sales has fallen sharply, down 30% yoy in July. In major cities such as Vancouver, the decline in sales is even larger. Those who followed the U.S. housing crash were sensitive to the first tremors in late 2005/early 2006 as the number of sales dropped while prices continued to rise. This is a clear sign that credit driven prices may soon peak and the supply of greater fools is contracting. In the current environment of global austerity and credit contraction a housing downturn can easily become a full-fledged crash. I believe this is much more likely than market prices would indicate.
In conclusion, the market is not pricing in any one of these scenarios, let alone all three. Even if they are individually unlikely, the risk/reward on this trade is very favorable, in my opinion. Finally, the technical picture makes the timing ripe for this trade. The two year chart shows a possible head and shoulders pattern. Shorter term timing is indicated by a “death cross” of the 200-day moving average below the 50-day moving average on July 13. Even more recently, EWC was unable to maintain its breakout above the moving averages, and dropped back below on August 11. The chart I am referencing can be found here: http://finance.yahoo.com/echarts?s=EWC+Interactive#symbol=EWC;range=1y


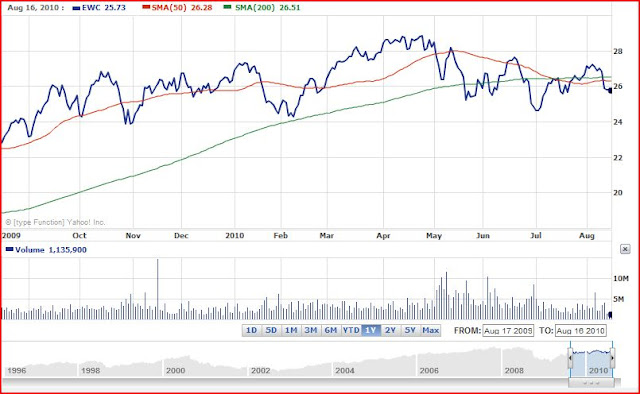
I expect a sharp breakdown in EWC over the next six months. My practice is not to predict specific price levels, but to watch for changes in market behavior and sentiment. I will look to cover the short position on a combination of a jump in volatility, chart breakdown, and bearish market consensus. However, I will cut my losses if EWC breaks out of its recent trading range and climbs above $27.25.

Why gold?

Isn’t gold a hedge against inflation? And there’s no inflation to be seen, at least in the U.S. (No, there isn’t.) In fact, if the owner’s equivalent rent fiction is replaced in the C.P.I. model with the Case-Schiller home price index, inflation is -5% and falling.

But if gold was an inflation hedge, Treasury yields falling from 4% in April to 2.58% yesterday should not coincide with gold climbing from $1,125 to $1,225. So we can throw that idea out the window. Clearly there’s more to gold than an inflation hedge. Personally, I believe that gold climbs in periods of extreme interest rates, be they inflationary or deflationary. A deflationary environment, for example, makes gold attractive for two reasons. First, it is safe because it is not based on anyone’s promise to repay, and if held as bullion cannot be defaulted on. Second, low interest rates mean that cash can be held as gold without any great loss of interest income.

Over the first half of this year, almost all global economic policy actions have been deflationary. Fiscal policy has swung from stimulus to austerity and monetary policy has been tightened. In the U.S., the stimulus has been spent, states are enacting billions in spending cuts, and consumer credit is plunging faster than ever. The upcoming elections will most likely result in gridlock, and not conducive to economic stimulus. Tax cuts are just as likely as cuts in unemployment benefits and loans to bail out states. Europe has embarked on sharp austerity measures. China has imposed lending caps, raised real estate taxes, imposed higher capital requirements on banks, and forced them to move certain loans back on balance sheets. Japan is frozen solidly in deflation and sub-1% GDP growth. Canada has raised interest rates. Australia has raised interest rates. Got the picture?

The global supply/demand picture is also positive for gold. Many people in emerging market economies are hoarding gold. Last year, Vietnam instituted controls on gold imports as savers grew fearful that the global economic crisis would engulf their economy. China is also a large player in the global gold market. The People’s Bank of China has increased their gold reserves at an increasing rate in recent years. Gold is also the only commodity that the central bank of China can safely buy without increasing commodity costs for its export industry. China is also, by some reports, the world’s second largest producer of gold. I would not be surprised in the least if China embarked on a secret strategy to increase their gold mining industry while supporting the global price of gold. The Chinese government loves blowing bubbles to increase employment, and there aren’t many possible assets left. Mining is a labor-intensive industry, and China will need something to keep its construction workers employed.

That’s the fundamental macro-economic backdrop. Now for the technical analysis. I will use GLD for the ease of using Yahoo Finance! charts. The one year chart can be found here: http://finance.yahoo.com/echarts?s=gld. It shows GLD encountering resistance at the recent highs of $122-3 ($1,250-60). GLD survived a test of the 200-day moving average and made a recent low on July 27. Since then, it climbed above the 50 day moving average last week on August 12. In my opinion, it looks poised to break out significantly.


If I am wrong, I expect GLD to drop back below the 50-day moving average and will sell at $115. In the meantime, I will watch for any news relating to gold and China. If gold rises parabolically, I will consider taking profits and rebalancing my position if it climbs 20% over the 50-day moving average.

Disclaimer: The above analysis is not a recommendation to buy any security. It is merely my own personal opinion on positions I may or not participate in. Investments should take into consideration investor risk tolerance, time horizon, and sophistication.

Full Disclosure: short EWC, long gold bullion, long several gold stocks, long gold stock calls.

Monday, August 16, 2010

Can China Crash the US Treasury Market?

Recently, there has been much vocalizing by bond bears in regards to a "Treasury Bubble." These bears point to the enormous U.S. budget deficit, expected to reach $1.47 trillion this year. This increase in supply would normally be expected to exert downward price pressure. On the demand side, they point at China and ask what happens if Chinese demand for Treasuries drops?

This question may have just been answered. ZeroHedge has just analyzed data showing that China's Treasury holdings are down by $100 billion in the last twelve months. This must come as a serious surprise to the myriad of Bond Bears who believe in a "Treasury Bubble."

China has been very busy buying Yen and Euros instead of dollars this year. And guess what? It hasn’t hurt the Treasury market one iota. Instead, the Yen is at a 15 year high against the dollar. The euro has climbed from $1.20 to $1.30. And surprise, surprise, the Yuan has fallen 1.8% against the dollar in the last five trading days.


China can’t sell big chunks of Treasuries for many reasons. First, the political backlash would be huge if they drove prices down and took losses. Second, what would they buy instead? Buying commodities will increase the inflation that’s already picking up in China. You yourself posted about how increases in raw materials is a death-blow for low margin exporters. What else can they buy? They’re already buying Yen and Euros. If this is increased, Europe has no qualms about protectionism. Japan will just print, knowing that inflation will hurt China more.

The simple fact is that China is not buying Treasuries because it's getting more bang for the buck by buying the Yen and the euro. The data from the past year should convince the bond bears that they need to find more arguments besides "China might sell Treasuries."
Finally, I would like to thank two sources authoritative sources I am indebted to. Michael Pettis provides the best analysis of China in a global context that I have seen. His analysis of the structure of China's economy and what the People's Bank of China can and cannot do is spot on. Dave Rosenberg is the best US economist I know.

Labels: ,

Saturday, August 14, 2010

Expectations on Bonds and Stocks for the Near Future

Bernanke disappointed the market by not firing up the printing machines on Tuesday. It even has a name: QE2, for quantitative easing round 2. This disappointment generated a solid market thud on Wednesday as the "buy the rumor, sell the news" traders suddenly had no news to sell. Ouch. Wednesday's market behavior was also notable as stocks reversed their two month habit of rallying on bad economic news.

The bond market, on the other hand, has continued charging ahead stronger than ever. No doubt those who believe Treasuries are in a bubble are confused. My expectation is that this market behavior will continue. With the spector of Bernanke buying more bonds, look for the 30-yr. Treasury to gain on any news of economic weakness. This trade should hold up until either economic fundamentals improve (unlikely before next year) or Treasuries start reacting to news differently. This would entail Treasury yields rising (prices falling) on economic weakness or yields falling on better than expected economic news.

Labels: , , ,

Thursday, August 12, 2010

Confirmation of a Trend Change

Today, I received more confirmation of the major trend change that announced itself yesterday. Yesterday, by the way, was the first big drop in stocks that coincided with a rise in bonds in two months. See this chart from Yahoo! Finance. Ever since the QE2 rumor came out, negative economic news was good for stocks. But now that's a dud, with no news to sell. It's a traders's nightmare. From the Investor's Intelligence survey, we learn that bulls outnumber bears by 42% to 28%.

Today, there's more confirmation. After yesterday's collosal move in Treasuries, I expected some give back. Out of 11 basis points, only 1 has gone back. Stocks, on the other hand, are showing lots of weakness. It's time to get aggressive.

The economic fundamentals are nauseating. Dave Rosenberg states that the 2.4% GDP growth estimate from Q2 will probably get sliced in half to 1.0-1.5%. In the absence of any growth drivers, we'll see 0% to -0.5%  for Q4. Rosenberg's got $80 for S&P500 earnings next year. I think this could get priced in by the end of this year. I'll throw a 12X multiplier on that and forecast 960 by the end of the year.

Now there's the question of how to play this. I believe that due to the European austerity, raising of interest rates in Australia and Canada, and tightening of credit in China, US weakness will be magnified in emerging markets. So I should buy EDZ. Another one to look at is EWC (MSCI Canada index) as either a short or to buy puts on. The Canadian housing market is rolling over, the currency is slightly overvalued, the US is sliding fast, and weakness in China could crush the commodity industry. I got a distinct feeling of foreboding upon reading this data from Rosenberg, which is more important to me that any rational explanation. The gut learns patterns much more quickly than the rational part of the brain. As far as the puts go, volatility is very low for the March '11 $24 puts at 33. I've put them on the watchlist.

Trade:

Buy 10% position in EDZ @ $37.88.

Tuesday, August 10, 2010

Sell the News, Almost

Well, the Fed's announcement today was anticlimatic. Nothing new or exciting here. The long bond caught a 1% bid that quickly faded. Bernanke said the Fed will roll over their existing holding to "Bolster Recover". How is rolling over existing positions going to do anything? Maybe it will change the mix from GSE bonds towards Treasuries. The real news to me is that Bernanke thinks the recovery is fading, but isn't doing anything about it. Maybe he has an Orwellian fear that if he announced stronger measures, he'd spook the market. He's probably right.

Anyway, since the bounce in bonds was minuscule, there's nothing for me to do. Boring day.

Monday, August 09, 2010

Deflation Has Become a Mainstream Worry

When Goldman Sachs lowers their GDP growth forecast, then you know it's time to go the other way. The word "Deflation" is all the rage almost everywhere.

Not sure how I'm going to play this yet, but the immediate reaction after the Fed's announcement tomorrow will be an opportunity. Maybe to sell my bonds.

Friday, August 06, 2010

Remember the Exxon Valdez

Increased regulation in the wake of the Exxon Valdez oil spill set the stage for a golden age of shipping companies like Frontline. The increased costs imposed by governments mandating double hulls put many smaller shippers out of business. It allowed the giants to grow and control the industry. In addition, it gave the oil companies a strong incentive to lease ships instead of owning their own.

This article from the Wall Street Journal is entitled New Drilling Rules Imperil Some Rig Operators. It explains that new blow-off preventers (BOPs) mandated by congress are too large for many old rigs to accomodate without spending "billions of dollars to upgrade them." Many rigs will move from the gulf.

In my opinion, the WSJ has this story all wrong. It should say something like "Golden Future for Rig Operators with Modern Fleets." Time to buy more Seadrill. I would not be surprised to see the dividend bumped up to $0.75/quarter by Q1 '11.

However, I'm going to wait a little on this, as the chart shows Seadrill at a significant premium to the 50-day moving average.

Thursday, August 05, 2010

What happened to 10-yr note/S&P 500 correlation?

Right at the beginning of July, there started a significant breakdown in correlation between Treasuries and stocks. See this chart from Yahoo!

Or maybe the market thinks QE2 is good for both bonds and stocks?

I'm also thinking about gold and China. With China expanding its presence in the gold market, I'm curious about the government's motivations. Is it possible that they may try to create a gold bubble to replace their deflating real estate bubble? Hmmmm. China is the world's second largest gold producer. Mining does create a lot of jobs. Rural mining jobs and development in the interior of the country will keep farmers from immigrating to the cities. Definitely worth thinking more about. This could be huge.

Tuesday, August 03, 2010

Why Bonds?

There are plenty of bonds bears out there. The reasons are endless: too much supply, China will stop buying, the deficit is too big, bond prices are too high, and on and on. Here is why I'm a bond bull:
  • Consumer demand for credit is plunging, and consumers are 70% of the economy.
  • Baby boomers need income. Only 3% of their assets are in Treasuries. Bonds have beat stocks over the last 10 years. Who wants to put $ in CD's?
  • Obama's stimulus is almost gone.
  • Gridlock is a done deal in 3 months.
  • Unemployment is still near record highs.
  • Housing is plunging, and housing typically leads the economy.
  • Factory orders are plunging.
  • Consumer confidence is plunging.
  • Leading economic indicators are plunging.
  • With GDP set to drop to 0% by the end of the year, aren't real rates juicy? Historically, bond yields have a high correlation to GDP growth.
  • Austerity from Europe will start to bite by the end of the year, if not sooner.
  • Chinese banks have already reached their lending quotas for the year.
And if I'm wrong? Well, if yields spike, gold will be a perfect hedge.